When the Numbers Tell a Story: What We’re Learning from CESA Admissions Benchmarking
Have you ever had someone come into your office – maybe a faculty member, maybe a parent – and start a sentence with “everybody is saying…”? I would guess most of you have. What follows that clause might be accolades. “Everybody is saying the Open House last night was the best ever!” But sometimes that clause is followed by something less generous. “Everybody is saying that they are concerned about the applications the middle school is reading”. When we work in schools, it is often hard to know how we are really doing. Sometimes, it is the positive anecdotes that distract us from the reality of our situation. Other times, the small but vocal minority might tempt us to believe the sky is falling. And that is why we need quality data to help us better understand our own reality and whether the ripples we are seeing are unique to our context or part of a bigger story. This is why I am so grateful for the time and energy our schools are investing in DASL data entry, and why I am thrilled to provide several benchmarking reports for your leadership teams to contemplate. Today, we wanted to share some thinking around the CESA Admissions Benchmarking Report.
The last several years have brought both remarkable growth and new questions. While many independent schools nationwide have struggled to maintain enrollment, CESA schools as a group have experienced steady enrollment growth and strong student retention. At the same time, early signs of softening demand in some parts of the admissions funnel suggest that the post‑pandemic “boom” is giving way to a more complex and competitive reality.
We want to be disciplined in how we use these reports, as skimming the surface of the averages will help us make strategic decisions. As Katherine Collins so wisely notes, “averages hide opportunities”. We know that opportunities live in the edges, so as you review these averages, especially in light of your own reality, it is our hope you can use the averages AND see the opportunities on the horizon.
Enrollment: Growing in a Shrinking Market
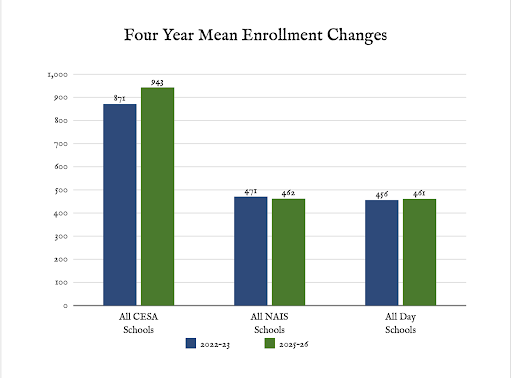
A notable finding in the latest round of data is that CESA schools have seen enrollment growth each of the past four years, while other comparison groups have remained flat or declined (see Figure 1 below). On average, a CESA school now serves 72 more students than it did four years ago, equivalent to 3-4 classrooms of students. Trends like these indicate that, despite demographic challenges, families are investing in Christian education. As we know, growth is not an accident; it usually reflects a compelling mission, strong word of mouth, and a clear sense of purpose that resonates with both long‑time Christian school families and those exploring Christian schooling for the first time.
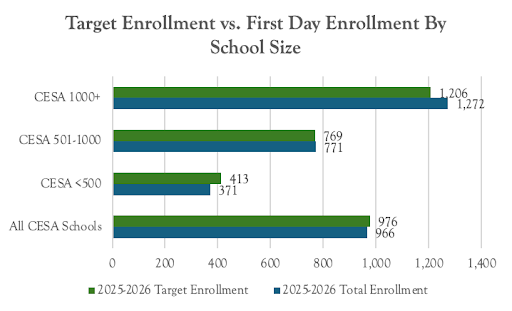
There is, however, a caveat to these encouraging averages. As a whole, CESA schools enrolled slightly fewer students on the first day of the 2025-26 school year than planned for (See Figure 2). Our largest schools, those over 1000, outperformed that average, however. Those schools enrolled 5.4% more students on opening day than their targets, while schools under 500 were, on average, 10.5% below their targets. It is worth exploring, especially for our mid-sized and smaller schools, how the local market, as well as admissions and marketing staffing (more on staffing in the full report), may be impacting student enrollment.
Admissions Funnel: Fewer Doors, Stronger Decisions
Beneath the headline of enrollment growth is a more nuanced admissions story. In many CESA schools, key middle-of-the-funnel metrics: application, acceptance, and yield remain healthy. Put simply, when families receive an offer, they are very likely to enroll: for every 10 offers, nearly 9 students enroll in the fall.
However, the top of the funnel has changed, especially for larger schools, with many schools seeing declines in inquiries. In the past, more families would ask for information before applying. Now, for every 100 families who might have inquired several years ago, only about 75–80 are doing so. While this quantitative reality might mean that overall interest is declining, it may also mean that parents are shopping around less for their children’s education. This reality may make open houses feel different; it may inspire a conversation about how schools clearly articulate their missions at the outset of partnerships with families, so that parents’ expectations align with the value proposition a school presents.
Retention and Attrition: Staying Power as a Strength
If admissions answers “Who is coming?”, attrition asks “Who is staying?” CESA schools show a distinctive strength here. Median CESA attrition in the benchmarking data is lower (6.3%) than norms for NAIS (8.1%) or national independent day schools (8.7%). This is very good news. As tuition costs and living expenses rise, most families regularly evaluate if the investment is “worth it”, and these statistics reflect that the promises made during admissions are being met to a very high degree of satisfaction.
At the same time, the data also helps each individual school ask hard questions. When a school’s attrition exceeds the CESA median, it invites leaders to look closely at transition points (into middle school and into high school), tuition increases, program changes, or shifts in culture that might be affecting families’ decisions to stay or leave. Perhaps it is time to implement a strategy to better understand parents’ perceptions before the annual survey goes out in the spring! Perhaps regular tracking of a net promoter score will help you hear beyond the positive and negative outliers that tend to have an outsized influence when we lack a regular, strategic mechanism to understand our families’ experiences.
Financial Aid and Tuition: Access and Sustainability in Tension
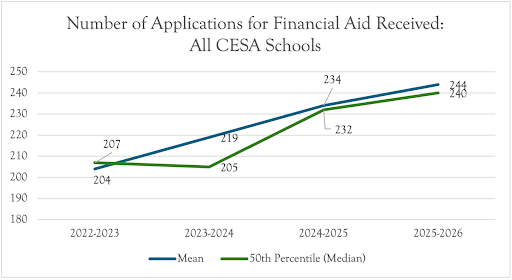
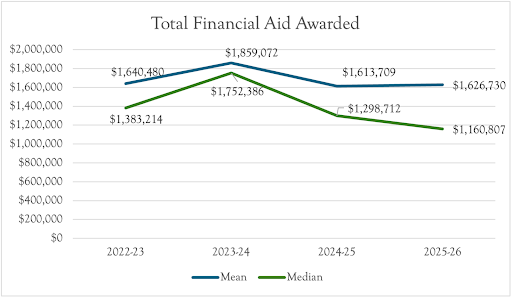
This year’s benchmarking report also sheds light on how CESA schools are investing in financial aid. While we see the total number of applications for financial aid has risen over the past four years by nearly 20% (see figure 3), the amount of financial aid awarded has largely stayed flat (See figure 4). This observation, in our estimation, is worth consideration. Why, for example, have the number of applications risen? Has the number of awards risen proportionately? Does that then indicate that the awards are also smaller in a season where tuition has risen, on average, by over 10%? Has that had an impact on overall enrollment? Does your financial aid committee have a long-term strategy, connected to a strategic financial plan and enrollment plan, to ensure we are serving the right students for our mission? While these conversations are complex, the reality is that each school must have a plan for using financial aid purposefully to achieve its strategic priorities.
Using Benchmarks Wisely: Direction, Not Destination
Perhaps the most important lesson from the report is how to use benchmarks wisely. It is tempting to treat medians and means as scorecards, to feel affirmed if we are “above average” and anxious if we are not. But CESA’s benchmarking work is not about ranking schools. It is about helping leaders see patterns, ask better questions, and make more informed, mission‑aligned decisions.
Hopeful Realism for the Road Ahead
The overall picture that emerges from the benchmarking work is one of hopeful realism. CESA schools, as a group, are experiencing healthier enrollment and stronger retention than many peer institutions. That is cause for genuine encouragement. At the same time, early headwinds should be recognized and monitored. These trends require thoughtful, proactive leadership and collaboration within and across CESA Schools.
Katie played a role in CESA’s founding and served as its original Director of Academic Advancement. In that position, Katie co-wrote the original CESA standards and helped develop the initial institutional review process. She also played a major role in organizing the early CESA symposia and heads retreats.
She has served on the faculties of Wheaton College, Boston University, Gordon College, and Kennesaw State University, and currently teaches in graduate programs at Baylor University and Taylor University. She also serves as Fellow with the Institute for Advanced Studies in Culture at the University of Virginia, is a Research Fellow with Cardus, and is a research scholar at Baylor’s Center for School Leadership.
Katie also has extensive experience in K-12 Christian schooling, having served as an administrator and faculty at several private Christian schools. She has her bachelor’s and master’s degrees from the University of St. Thomas, and her doctorate from Boston University.
Katie can be reached at kwiens@cesaschools.org or you can use the button below to schedule a virtual appointment with her.